2022 Financial Review
We’re starting a new year, and reviews are popping up everywhere. In my case, 2022 was a busy year in many ways, both good and bad, and I’m not a big fan of reviews. However, one of the major additions to my life in 2022 was a much more precise management of my finances (and a welcome to the world of investments) thanks to Mujer Financiera. Thanks to their courses, I learned to manage my finances in a very complex year for the Argentine economy, and while I never had problems with spending or credit cards, I was able to organize my savings systematically. This allowed me, among other things, to have eye surgery without depleting my savings. Therefore, while everyone else is doing emotional reviews, I’m going to close out my 2022 with a financial review.
This review is inspired by Mujer Financiera’s program Plan Your 2023, which begins with a 2022 diagnosis, proposing a series of annual balance sheet reviews, such as annual income and expenses, credit card averages, etc. This post is a continuation of that other (private) review, with other metrics that I find interesting and that go beyond this diagnosis. The goal is to show some points for reviewing the annual budget to start understanding how the year went. The things that can be analyzed in an annual budget are infinite: here I will only show a couple of aspects to get started.
Introduction
The first thing you need to know to understand what follows is the work dynamic proposed by MF. The best way to learn about it is through their courses (specifically Finanzas en orden), but the basic idea is to set up a budget (read: a spreadsheet) where we record month by month how much money we received, how much we allocated to savings, and how much we spent, both on fixed expenses (those we cannot decide whether to pay or not, such as rent, gas, credit card, etc.) and variable expenses. The idea is that once we have an idea of how much we spend, we start developing an estimate (budget) for the following month, itemized by categories; this way, we can start controlling how much we spend on each thing. It seems complex, but with this world of virtual payments, it’s actually not that difficult once you incorporate it into your routine (especially if you’re like me and never carry cash). They also have an app, but I find it more useful to sit down once every two or three days with my computer and input all the information.
So, we have three row sections (income, savings, expenses - fixed and variable) and for each month, two columns (budget and real). The first month is dedicated to recording all expenses to understand what we spend on; I believe it’s only by the third month that we can create a budget adjusted to our real expenses. Something that greatly changed how I understood my finances was that the budget column allowed me to incorporate an estimate of monthly inflation, which in Argentina has been a rather sensitive issue. The budget looks something like this, in a very simplified way:
## Warning: package 'tibble' was built under R version 4.4.1## Warning: package 'purrr' was built under R version 4.4.1## Warning: package 'stringr' was built under R version 4.4.1## Warning: package 'gt' was built under R version 4.4.1Enero | ||
|---|---|---|
| Budget | Real | |
| Ingreso_1 | 50 | 55 |
| Ingreso_2 | 50 | 50 |
| Ahorro | 20 | 20 |
| GastosFijos_Alquiler | 40 | 40 |
| GastosFijos_Expensas | 10 | 10 |
| GastosVariables_Comida | 25 | 28 |
| GastosVariables_Transporte | 5 | 2 |
The objective of this post, then, is to propose some starting points for analyzing the annual budget that can help rethink finances. The possibilities are endless; here I will only work with three variables (income, savings, expenses), but more could be incorporated, such as investments.
How were fixed and variable expenses distributed throughout the year?
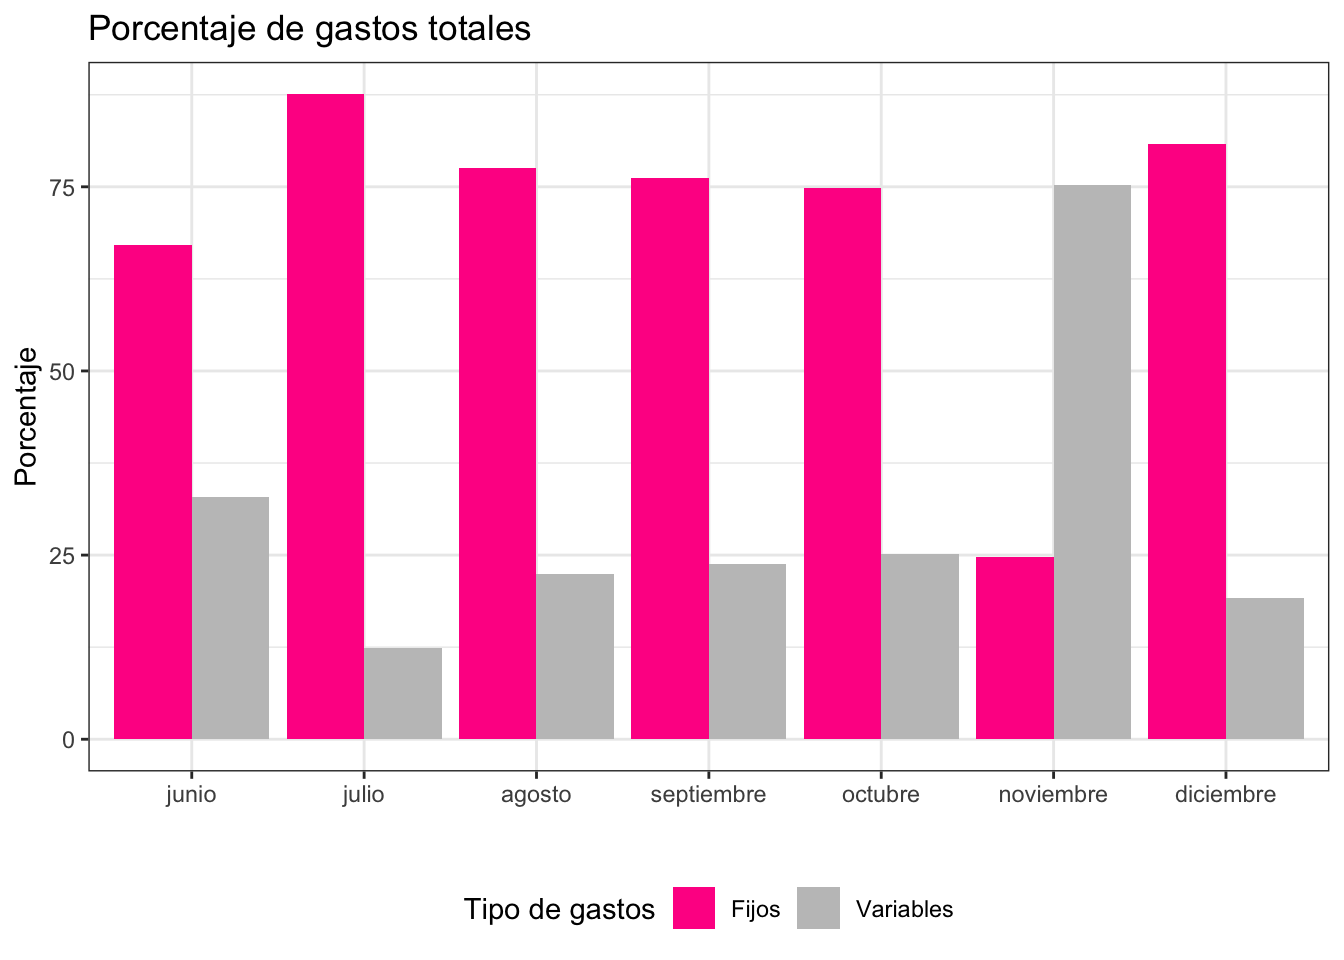
Fixed expenses are those we have to pay every month and whose amount we cannot change, such as rent, utilities, etc. Fixed expenses should represent double the variable expenses, or in other words, variable expenses should not be more than half of fixed expenses. In my case, this proportion was maintained quite well with the exception of November, because that was the month I had eye surgery and had to make a rather large (planned) expense.
What percentage of my income did expenses represent throughout the year?
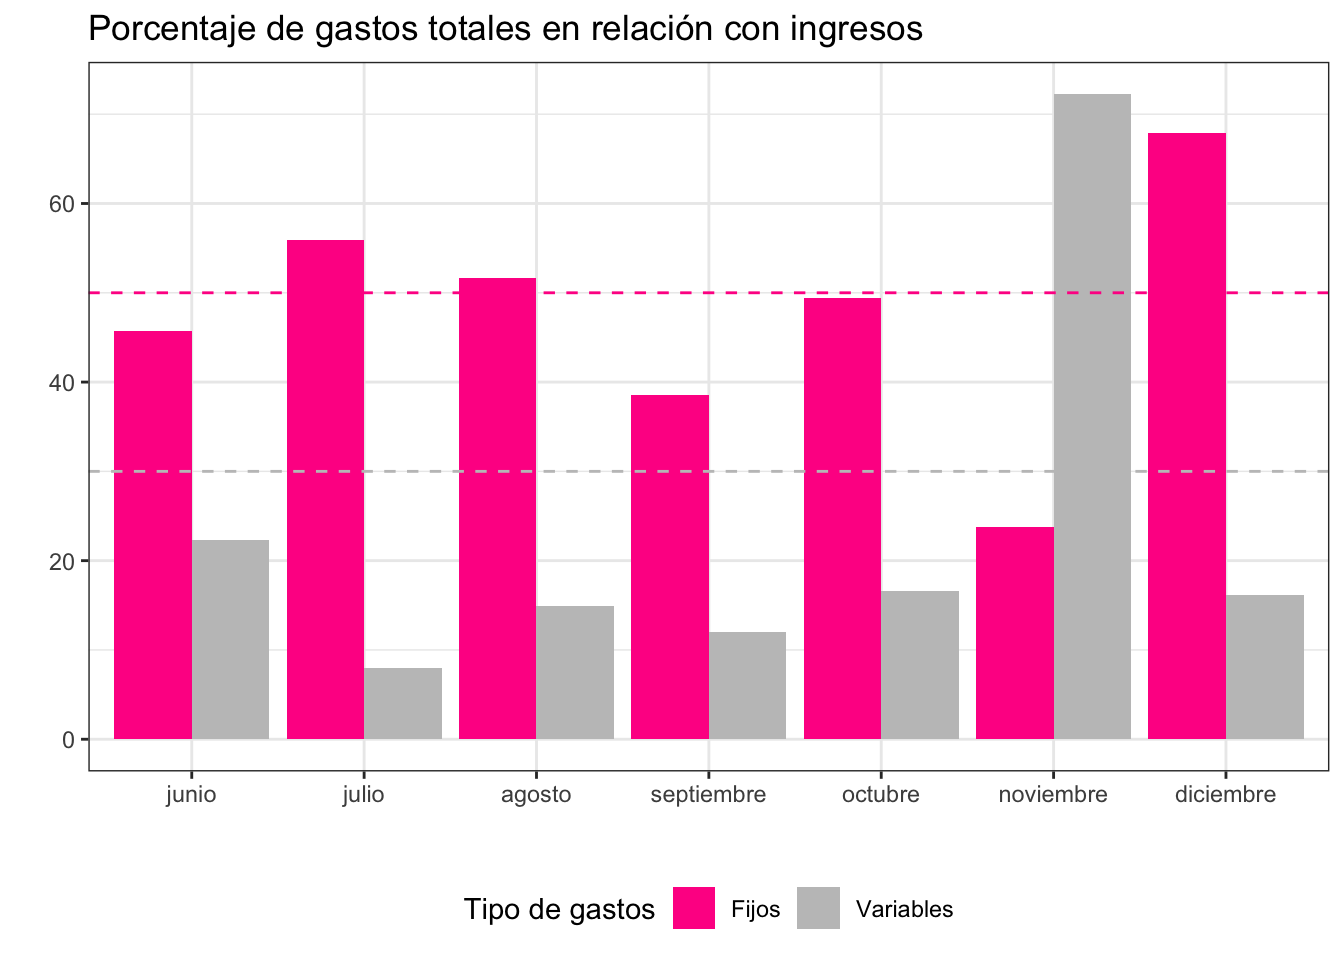
Generally, it is suggested that fixed expenses do not exceed 50% and variable expenses do not exceed 30% of income, but there are also other perspectives that propose unifying both types of expenses. In both cases, I think the balance is quite positive. However, there’s a catch: credit card expenses are considered fixed expenses, precisely because not paying the full card balance incurs a series of interests that can complicate our lives; so, since I paid part of the eye surgery with a credit card, these numbers in November and December are a bit unusual.
At first, this methodology might seem counterintuitive, because sometimes we pay for things with a credit card, such as a delivery or a circumstantial purchase, which are more associated with variable expense categories. However, I believe this way of thinking about credit card expenses tries to escape categorization based on “what I bought” (delivery, gift) and instead focuses on “how I have to pay for it” (as a fixed payment every month).
These distinctions help us gain awareness about how we use money and, especially, how payment methods impact that usage. For example, it might seem that paying with a debit card and paying in one installment with a credit card are similar, but when we look closely at the credit card statement and live in Buenos Aires, we encounter a stamp tax that significantly increases our expenses. So, the next time we have to pay for something, it shouldn’t be indifferent whether we pay with one plastic card or the other.
In which categories did I spend the most this year?
| Categoría | Item |
|---|---|
| GastosFijos | Compartidos |
| GastosFijos | Prepaga |
| GastosVariables | Salidas |
Another important review is the category in which we spend the most money. In this case, my biggest expense is shared household costs, followed by prepaga (which in Argentina is private health insurance), and thirdly, going out. It’s always interesting to keep in mind which categories we spend the most on, because those are where we can work hardest to reduce them. One could also look at the lowest and most sporadic expenses, which are sometimes the famous ant expenses (small, frequent expenses that add up).
When I try to convince people around me to implement a budget spreadsheet or to record all expenses, the first thing they tell me is I know what I spend on. And, mind you, that might be true: I also thought I had a pretty clear idea of where my money was going. But by doing this spreadsheet, I realized that it’s one thing to know where we spend large amounts (clothing or appliance purchases, big outings, etc.) and a very different thing to know where we spend small amounts many times. I believe that’s the real change: seeing how seemingly unimportant expenses add up. And seeing them over an entire year is even more impactful.
Conclusion
These are just some of the issues that can be looked at in annual reviews. One can also delve deeper into categories and how they vary: Is there seasonality in expenses? What about income: is it always the same? How does it relate to inflation? How can savings be projected based on defined goals? What percentage of unbudgeted expenses occurred? In which categories was less spent than budgeted, and in which more? And many, many more.
I definitely believe there was a before and after regarding the moment I started recording all my expenses. I recommend it.
Macarena Quiroga
Linguist/PhD student
I research language acquisition. I’m looking to deepen my knowledge of statistis and data science with R/Rstudio. If you like what I do, you can buy me a coffee from Argentina, or a kofi from other countries. Suscribe to my blog here.